





PgBouncer Pool Size: Why the Rule of Thumb Is Too Small
Tested by M. Aziz, November 2026 on PostgreSQL 18.7 and PgBouncer 1.26.1, AWS ap-south-1 · Tested by Mohammad Aziz, backend engineer at Selfhost.dev ·
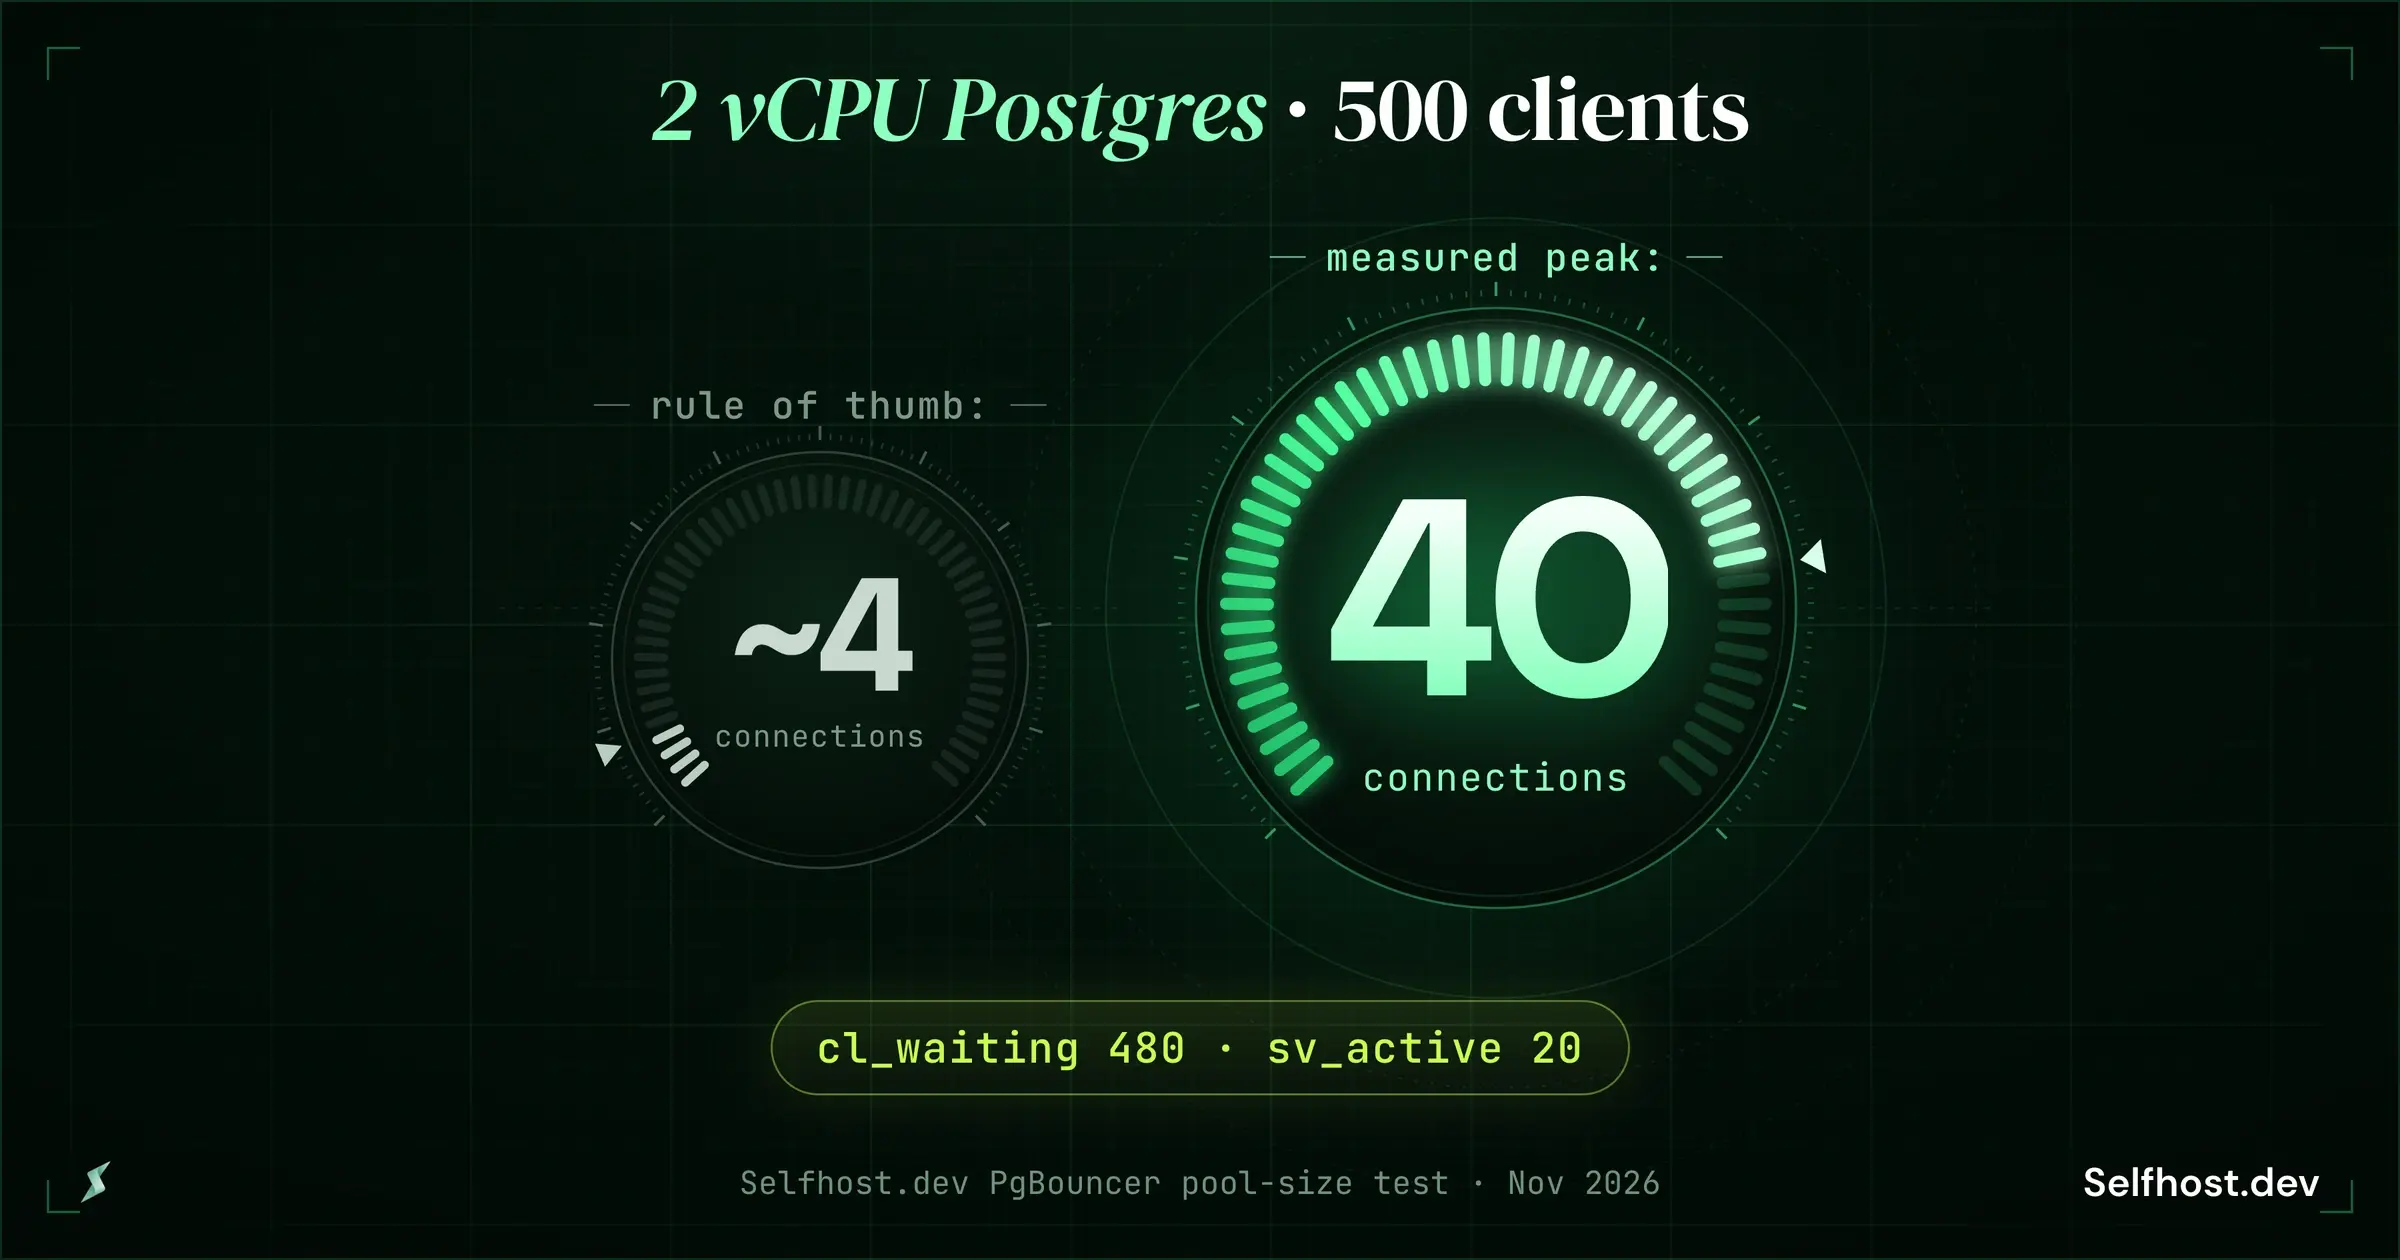
The PostgreSQL wiki’s rule of thumb gives a 2 vCPU database about 4 active connections. In the Selfhost.dev PgBouncer pool-size test (Nov 2026), throughput peaked at 40.
PgBouncer lets thousands of clients share a few dozen Postgres server connections. Across 2, 4 and 8 vCPU, the best PgBouncer pool size for 500 clients was 40 to 80: far above the per-core formulas, far below the client count. Every command and output below comes from a dated run.
Table of Contents
KEY FACTS
- Pool size: in Selfhost.dev’s test, a 2 vCPU Postgres 18 instance with 500 clients peaked at 4,863 TPS with 40 server connections, and ran 13% slower at 160.
- Starting point: Selfhost.dev’s measured starting point is about 20 server connections per vCPU, capped near 80, which fit every size tested. Per-core rules in guides and AI answers give 2 to 4 per vCPU.
- Connection churn: with 500 clients opening a connection per transaction, direct Postgres served 192 TPS at 61% CPU. Through Selfhost.dev’s managed PgBouncer it served 313 TPS at 17% CPU.
- Prepared statements: they work in PgBouncer transaction mode since 1.21 when
max_prepared_statementsis above 0, which is the default (200) since 1.24.0.- search_path: on Postgres 18 with PgBouncer 1.26.0 or later,
SET search_pathno longer leaks between clients.SET statement_timeoutstill does.- A 2 vCPU / 8 GB managed Postgres, the same size as the tested instance, costs $52.76 a month in Mumbai with PgBouncer included: see that setup priced, with nothing to fill in.
What is PgBouncer, and when do you need it
PgBouncer is a lightweight connection pooler that sits between your application and PostgreSQL and serves many client connections from a small pool of server connections. It usually listens on port 6432. In transaction mode, the default most people should use, a client holds a real server connection for one transaction and returns it at COMMIT.
app instances (hundreds or thousands of connections)
        │
        ▼
PgBouncer :6432   ── client side: cheap, thousands are fine
        │
        ▼
a few dozen server connections
        │
        ▼
Postgres :5432    ── one process per connection
Postgres starts an operating-system process for every connection, and each one costs memory even when idle. As traffic grows, connection limits are often what breaks first.
Signals that you need it:
- Your app gets
remaining connection slots are reserved for roles with the SUPERUSER attributeorsorry, too many clients already. pg_stat_activityshows manyidleconnections. Selfhost.dev’s test measured about 1.7 MiB of RAM per idle direct connection (400 took the instance from 9.3% to 18.1% of 7.6 GiB).- Your app opens a connection per request (serverless, PHP, many Python setups), or autoscaled app servers each bring their own pool.
When you don’t need it: one long-running app server with a well-sized built-in pool (HikariCP, SQLAlchemy, pgx) under max_connections. At 50 clients, direct connections gave 4,325 TPS and PgBouncer 3,588.
How we tested
| Part | Setup |
|---|---|
| Database | Selfhost.dev managed PostgreSQL 18.7 on m7i.large (2 vCPU, 8 GB); sweeps also on m7i.xlarge (4 vCPU) and m7i.2xlarge (8 vCPU). 50 GB gp3, max_connections 512, 3 reserved for superusers |
| Managed pooler | Selfhost.dev managed pooling: PgBouncer 1.26.1 on the database host, port 6432, scram-sha-256 logins only. Defaults: transaction mode, default_pool_size 20, reserve_pool_size 5, min_pool_size 0, max_client_conn 100 (raised to 1,100 here). Upstream PgBouncer defaults to session mode and no reserve pool |
| Self-run pooler | PgBouncer 1.26.1 in Docker on its own 2 vCPU c7i.large, same settings unless a test says otherwise |
| Client | c7i.xlarge (4 vCPU, 4 pgbench threads) in the same zone; c7i.2xlarge (8 threads) for the 8 vCPU sweep, where it stayed 84% idle |
| Data | pgbench -i -s 100, 1,503 MB |
| Workloads | A: TPC-B read/write · B: pgbench -S read-only · C: pgbench -C, a new connection per transaction |
| Each run | 60 s; percentiles from a 20% sample of transaction logs; backends sampled each second |
Each sweep point ran once for 60 seconds, and TLS was off on all test connections. Four of five repeated runs landed within 2%; one read-only run differed by half, so treat small differences between single runs as noise.
Postgres connection pooling vs direct connections, measured
Selfhost.dev’s managed PgBouncer kept every run working at 200 clients and more, while direct connections failed at 500, and it halved p95 latency at 200 clients. With a new connection per transaction, it raised throughput by about half and cut database CPU from about 60% to under 20%. With 50 long-lived clients, direct was slightly faster.
Table 1: Selfhost.dev PgBouncer pool-size test (Nov 2026), throughput and p95 latency, direct vs managed pooler, 2 vCPU
| Workload · clients | Direct TPS | Direct p95 ms | Pooled TPS | Pooled p95 ms |
|---|---|---|---|---|
| A · 50 | 4,325 | 22.5 | 3,588 | 17.2 |
| A · 200 | 4,035 | 106.8 | 3,747 | 58.1 |
| A · 500 | run failed | n/a | 3,679 | 162.1 |
| B · 50 | 32,670 | 2.2 | 31,512 | 2.1 |
| B · 200 | 32,681 | 10.0 | 31,532 | 7.0 |
| B · 500 | run failed | n/a | 31,291 | 16.9 |
| C · 50 | 210 | 280.4 | 308 | 172.3 |
| C · 200 | 209 | 1,256.3 | 325 | 642.3 |
| C · 500 | 192 | 4,660.6 | 313 | 1,660.0 |
Table 2: Selfhost.dev PgBouncer pool-size test (Nov 2026), backends, host RAM and errors, same runs
| Workload · clients | Direct backends | Direct RAM | Direct errors | Pooled backends | Pooled RAM | Pooled errors |
|---|---|---|---|---|---|---|
| A · 50 | 62 | 28.5% | 0 | 34 | 29.5% | 0 |
| A · 200 | 234 | 42.2% | 0 | 35 | 30.8% | 0 |
| A · 500 | n/a | n/a | no slots | 35 | 31.1% | 0 |
| B · 50 | 56 | n/m | 0 | 25 | n/m | 0 |
| B · 200 | 225 | n/m | 0 | 25 | 31.3% | 0 |
| B · 500 | n/a | n/a | no slots | 25 | 31.0% | 0 |
| C · 50 | 56 | 31.4% | 0 | 25 | 31.0% | 0 |
| C · 200 | 219 | 36.0% | 0 | 25 | 31.3% | 0 |
| C · 500 | 502 | 43.4% | 14 clients | 25 | 31.3% | 0 |
“No slots”: Postgres refused connections and pgbench stopped; “14 clients”: clients pgbench dropped after a refusal. RAM: peak use of the 7.6 GiB host, from the console’s metrics; n/m = not measured. Backends include about ten monitoring and idle pooler connections.
Those 313 TPS came through a pooler that is a setting on the database, not a second server: see what managed Postgres with PgBouncer included gives you.
At C · 500, direct connections spent most of their 61% CPU starting processes and checking passwords. On reads, the extra hop cost little measurable throughput and bought lower p95 at 200 clients (7.0 vs 10.0 ms).
PgBouncer tuning: how big should the pool be
PgBouncer’s pool size should start from the database’s CPU and then be tested upward. On Selfhost.dev’s 2 vCPU instance, throughput climbed until 40 server connections, stayed flat at 80 and fell at 160. On 4 vCPU it peaked between 40 and 80, and on 8 vCPU at 80.
The Selfhost.dev pool-size sweep (Nov 2026)
500 clients, workload A, reserve_pool_size 0, one 60-second run per pool size. Managed pooler at 2, 4 and 8 vCPU; self-run pooler against the 2 and 8 vCPU databases.
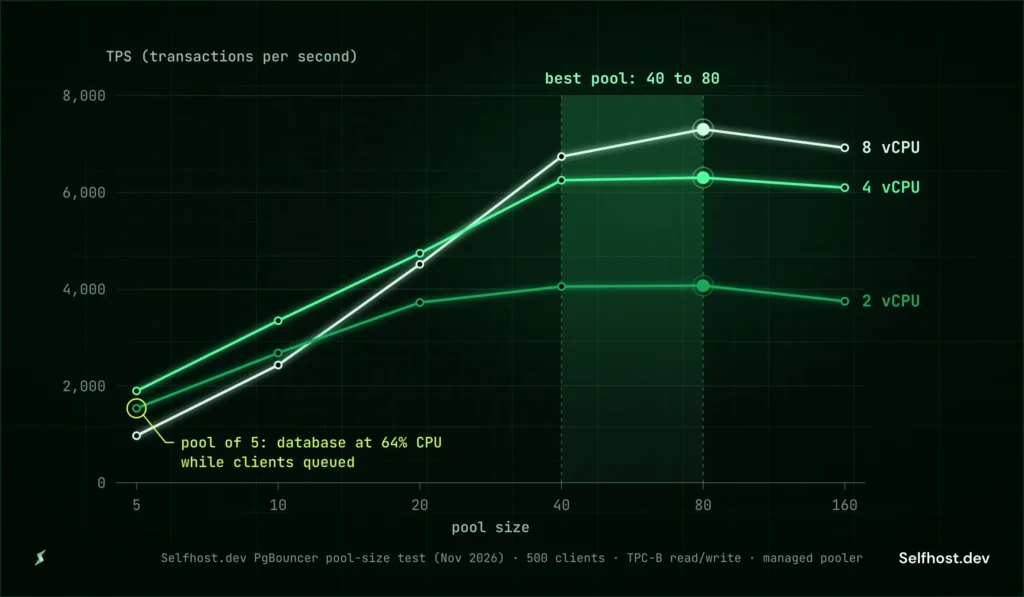
Table: Selfhost.dev PgBouncer pool-size sweep (Nov 2026), 2 vCPU database, managed and self-run pooler
| Pool size | Managed TPS | p95 ms | DB CPU | Self-run TPS | p95 ms | cl_waiting peak |
|---|---|---|---|---|---|---|
| 5 | 1,537 | 332.6 | 64% | 1,238 | 419.8 | 495 |
| 10 | 2,681 | 196.1 | 78% | 2,454 | 215.1 | 490 |
| 20 | 3,723 | 141.2 | 94% | 4,038 | 131.3 | 480 |
| 40 | 4,054 | 130.7 | 99% | 4,863 | 116.0 | 460 |
| 80 | 4,072 | 136.6 | 99% | 4,721 | 121.4 | 457 |
| 160 | 3,750 | 164.9 | 99% | 4,217 | 158.4 | 454 |
Table: Selfhost.dev PgBouncer pool-size sweep (Nov 2026), 4 vCPU database, managed pooler
| Pool size | Managed TPS | p95 ms | DB CPU |
|---|---|---|---|
| 5 | 1,896 | 278.8 | 41% |
| 10 | 3,348 | 167.5 | 54% |
| 20 | 4,739 | 118.6 | 67% |
| 40 | 6,250 | 102.2 | 80% |
| 80 | 6,303 | 115.8 | 85% |
| 160 | 6,097 | 126.7 | 88% |
Table: Selfhost.dev PgBouncer pool-size sweep (Nov 2026), 8 vCPU database, managed and self-run pooler
| Pool size | Managed TPS | p95 ms | DB CPU | Self-run TPS | p95 ms |
|---|---|---|---|---|---|
| 5 | 971 | 544.9 | 20% | 867 | 599.7 |
| 10 | 2,432 | 217.1 | 28% | 1,799 | 288.0 |
| 20 | 4,513 | 121.1 | 37% | 4,050 | 138.8 |
| 40 | 6,739 | 83.3 | 49% | 6,657 | 97.7 |
| 80 | 7,302 | 111.9 | 55% | 7,085 | 127.5 |
| 160 | 6,920 | 140.8 | 53% | 7,038 | 141.7 |
DB CPU: median host CPU from the console’s metrics. cl_waiting: from SHOW POOLS, self-run only.
On a 2 vCPU Postgres instance with 500 clients, Selfhost.dev’s test peaked at 40 server connections (4,863 TPS). At 160 connections throughput dropped 13% and p95 latency rose from 116 ms to 158 ms.
A pooler on its own server helped on the smallest database: 4,863 TPS against 4,072 for a pooler on the database host at 2 vCPU. On 8 vCPU the gap was gone (7,085 vs 7,302).
Why the rule of thumb is too small
The common pool-size formulas count CPU cores, and Selfhost.dev’s test found the best pool five to ten times larger. A connection in a transaction spends much of its time waiting on network round trips, write-ahead log (WAL) writes and row locks, not using CPU.
| Common advice | What Selfhost.dev measured |
|---|---|
| The PostgreSQL wiki: about “((core_count * 2) + effective_spindle_count)” active connections, about 4 on 2 vCPU | Peak at 40 on 2 vCPU. The wiki itself notes the formula hasn’t been analysed for SSDs |
| Guides and AI answers: 2 to 4 server connections per vCPU | 40 on 2 vCPU, which is 20 per vCPU |
| More cores need a bigger pool | Peak throughput rose from 4,072 TPS (2 vCPU) to 6,303 (4) and 7,302 (8), but the best pool stayed at 40 to 80 |
| More server connections, more throughput | Past the peak, throughput fell and p95 rose (pool of 160) |
| AI answers: “map thousands of clients onto 32 to 50 server connections” | Close for 2 vCPU (40); 80 won on 8 vCPU |
A TPC-B transaction makes seven round trips, and in transaction mode it keeps its server connection through all of them, network waits included.
On 8 vCPU the database never passed 55% CPU. Sampled at pool 80, active sessions mostly waited on WAL writes (LWLock:WALWrite, 841 samples) and on row locks (Lock:transactionid, 453), because TPC-B updates the same 100 branch rows. Commits and locks set the limit there.
These results come from short read/write transactions with the app on a separate machine, which is how most web apps run. Long CPU-heavy queries were not tested.
The connection math: pools, max_client_conn and max_connections
PgBouncer has four numbers that interact, and Postgres has one more:
default_pool_size: server connections per pool. A pool is one user + database pair, so two apps with different users get two pools.reserve_pool_size: extra connections after a client waitsreserve_pool_timeout.max_db_connections: a cap across all pools of one database.max_client_conn: total clients PgBouncer accepts.- Postgres
max_connections, minussuperuser_reserved_connections(default 3) andreserved_connections.
Keep pools × (pool size + reserve) + direct connections ≤ max_connections − reserved slots. For two apps (web, worker) and a migration user connecting directly:
pools:      web (40 + 5 reserve) + worker (20 + 5 reserve)   =  70
direct:     migrations 2 + monitoring 5 + admin headroom 10  =  17
needed:                                                         87
available:  max_connections 512 − superuser_reserved 3       = 509   ✓
If you set max_db_connections, it caps the 70 even when every pool is busy. Worker fleets hit this first; n8n queue mode workers follow the same math.
reserve_pool_size and min_pool_size
A reserve pool did not cut tail latency in Selfhost.dev’s burst test: 50 steady clients, then 450 more for 20 seconds, pool 20. With the reserve at 0 and 5, steady clients’ p99 was 144 and 143 ms (managed), and 149 and 146 ms (self-run). On a database already at full CPU, five extra connections can’t help. min_pool_size was not measured.
A practical starting pool size
“I’d start at 20 server connections per vCPU and stop at 80. On a 2 vCPU instance that is 40, where our throughput peaked. Then I’d watch
SHOW POOLSunder real traffic. Ifcl_waitingstays above zero while the database has spare CPU, I’d raise the pool. If CPU is at 100% and p95 gets worse as I add connections, I’d lower it. The wiki formula says about 4. At a pool of 5, our database sat near 60% CPU while 495 clients waited, so I’d measure my own workload before trusting any formula.”
Mohammad Aziz, backend engineer, Selfhost.dev
PgBouncer on Selfhost.dev managed Postgres
Selfhost.dev runs managed PostgreSQL on AWS from $8.10/mo in ap-south-1 (Mumbai), with PgBouncer pooling included on port 6432 and no separate proxy to run or pay for. Pooling is a toggle with three modes, and the console marks transaction mode recommended.
What the test showed about it:
- Connection churn: 313 TPS at 17% CPU with 500 clients opening a connection per transaction, against 192 TPS at 61% direct.
- Prepared statements on by default:
max_prepared_statements200, and 1,000 psycopg prepared queries with no errors. - Current and patched: pools enabled or reconfigured from 19 November 2026 run PgBouncer 1.26.1 with scram-sha-256 logins.
- Large instances: a 7,302 TPS peak on 8 vCPU, level with a pooler on its own server (7,085).
The console’s default pool of 20 suits the smallest instances, where a 1 GB database accepts 20 Postgres connections. On 8 GB and larger, the sweep says start near 40. You change it in the console, or from an AI editor through Selfhost.dev’s MCP server. Pooling is one of the features we line up in our managed PostgreSQL comparison.
A self-run PgBouncer exposes its full SHOW POOLS counters. Selfhost.dev’s console shows the pooler’s status, port and settings, and the Metrics page shows Postgres connection use, without waiting-client counts.
Teams that tune by cl_waiting can run their own PgBouncer, as in the Docker setup below. Selfhost.dev’s trade-off is a pooler you never install, patch or restart: PgBouncer 1.26.1 with scram-sha-256 on port 6432, included with the database.
Want to see where these settings live? The live demo console shows the pooling panel, default pool of 20 included, without creating an account.
PgBouncer transaction mode vs session vs statement mode
PgBouncer transaction mode is the right default unless something in your app needs a connection to stay its own between transactions. Session mode is the safe fallback for those clients. Statement mode is for special cases only, because it refuses multi-statement transactions.
| Mode | Server connection is released | What works | Who should use it |
|---|---|---|---|
| session | when the client disconnects | everything Postgres supports | migrations, LISTEN, apps that rely on session state; gives you little pooling |
| transaction | at COMMIT or ROLLBACK | everything inside a transaction; protocol-level prepared statements with max_prepared_statements > 0 | most web apps, workers and serverless functions |
| statement | after every statement | single-statement autocommit only; multi-statement transactions are refused | rarely. Through our managed pooler (4 vCPU) it refused BEGIN with FATAL: transaction blocks not allowed in statement pooling mode, and single-statement reads were slower than in transaction mode (50,974 vs 61,436 TPS, one 30-second run each) |
PgBouncer’s feature map lists what works in each mode. The next section shows what happens when you ignore it.
What PgBouncer transaction mode breaks: six things we reproduced
PgBouncer transaction mode breaks anything that expects session state to last between transactions. Selfhost.dev’s test broke six such features on purpose through PgBouncer 1.26.1, on the managed pooler and a self-run one, and both behaved the same. Forty background clients shared the pool, and a one-connection pool made leaks deterministic.
1. Session settings: some leak, some vanish
SET search_path stopped leaking in Selfhost.dev’s test, because Postgres 18 now reports search_path to clients like TimeZone. PgBouncer tracks it by default since 1.26.0.
A client that ran SET search_path kept it on its next statement, and 0 of 20 other clients saw it, even through a one-connection pool. You need both versions: on Postgres 17, or PgBouncer before 1.26.0, it still leaks.
Settings Postgres doesn’t report still break. Client A ran SET statement_timeout = '1234ms':
20 new clients ran SHOW statement_timeout: 1/20 saw 1234ms     (pool of 20, under load)
client A's own next statement sees statement_timeout = 0

through a one-connection pool:
20 new clients ran SHOW statement_timeout: 20/20 saw 1234ms
So the client that set it lost it, and a stranger got it.
Fix: use SET LOCAL inside the transaction; 0 of 20 clients then saw the value. Or set it per role with ALTER ROLE app SET statement_timeout = '5s', which 20 of 20 new connections picked up. Don’t rely on the connection string’s options=-c statement_timeout=…. Our managed pooler refused it (FATAL: unsupported startup parameter in options: statement_timeout). Our self-run one, which lists options in ignore_startup_parameters, dropped it without a word.
2. Prepared statements: mostly fine now, if the setting is on
Since PgBouncer 1.21, protocol-level prepared statements work in transaction mode once max_prepared_statements is above zero. That is what psycopg 3, pgx, asyncpg, JDBC and most ORMs use.
Since 1.24.0 the default is 200, and Selfhost.dev’s managed pooler uses that default: 20 psycopg clients ran 1,000 prepared queries through it with no errors. To see the failure we set it to 0 on the self-run pooler, using psycopg 3.1 with prepare_threshold=0 and pgbench in -M prepared mode:
self-run pooler, max_prepared_statements = 0
  psycopg: 20 clients x 50 executions: 102 succeeded, 18 clients failed
    prepared statement "_pg3_0" already exists
    prepared statement "_pg3_0" does not exist
  pgbench -M prepared: ERROR:  prepared statement "P_0" already exists

self-run pooler, max_prepared_statements = 200 (the default)
  psycopg: 1000 succeeded, 0 clients failed
  pgbench -M prepared: 53,848 TPS, no errors
SQL-level PREPARE and EXECUTE still fail, because PgBouncer doesn’t track them. PREPARE once, then EXECUTE 30 times: 29 failed with prepared statement "get_bal" does not exist. Fix: let your driver prepare statements at the protocol level, and check that max_prepared_statements isn’t 0 in your config.
3. LISTEN never hears anything
A listener behind PgBouncer missed the notifications in Selfhost.dev’s test. A client ran LISTEN blog_channel through the pooler and we sent five NOTIFY messages on a direct connection. It received 0 of 5 (1 of 5 through a one-connection pool, by luck of timing).
NOTIFY through the pooler itself worked without error. Fix: listeners connect directly to Postgres (port 5432) or through a session-mode pool.
4. Session advisory locks outlive the client
managed pooler, 40 background clients
client A: pg_advisory_lock(42)       -> ok, on backend pid 22753
client B: pg_try_advisory_lock(42)   -> false
client A: pg_advisory_unlock(42)     -> false, on backend pid 59954
  WARNING: you don't own a lock of type ExclusiveLock
after both clients disconnected, lock 42 is still held by:
  pid 22753, application_name 'pgbench', client 127.0.0.1
Client A’s unlock ran on a different server connection, so it couldn’t release its own lock. After both clients left, a pooled server connection still held it, labelled with the application_name of whoever used it last. That’s how a cron job ends up blocked by a lock nobody owns.
Through a one-connection pool, client B instead “acquired” the lock A already held, because they shared a session. Fix: pg_advisory_xact_lock() inside a transaction. It was held inside the transaction and released at COMMIT.
5. Temp tables disappear, or show up for someone else
One client ran CREATE TEMP TABLE tmp_report (x int) and then 30 inserts. 29 of 30 failed with relation "tmp_report" does not exist.
Through a one-connection pool every insert worked, and all 20 other clients could see the table. Fix: create it inside the transaction that uses it, with ON COMMIT DROP. That worked every time: create, fill 100 rows, read, dropped at COMMIT.
6. Migrations lose their safety settings
A migration’s SET lock_timeout vanished before its ALTER TABLE in Selfhost.dev’s test. We ran a typical migration file through the managed pooler with psql -f (autocommit) while 40 clients used the pool:
SET lock_timeout = '2s';
SHOW lock_timeout;                 -- returned 0 in 3 of 3 runs
ALTER TABLE pgbench_branches ADD COLUMN note text;
CREATE INDEX CONCURRENTLY pgbench_history_mtime_idx ON pgbench_history (mtime);
The lock_timeout was gone by the very next statement, so the ALTER TABLE ran with no timeout. A migration meant to give up after two seconds can instead queue behind a long transaction and block every query on that table.
pg_dump did work through the managed pooler, because it runs inside one transaction: the 10-million-row table dumped without errors. Fix: run migrations, dumps and long analytics jobs on a direct connection (port 5432) or a session-mode pool. For heavy, repeated analytics, it often pays to move heavy analytics off Postgres altogether.
That is why both ports are on every managed Postgres instance with pooling on: 5432 for migrations, dumps and LISTEN, and 6432 for the pool.
Common PgBouncer errors and what they mean
Most PgBouncer errors mean one of three things: too many clients, a pool too small for the load, or a restarting database. Selfhost.dev’s test caused each error below on purpose and recorded the exact message, its cause and the setting that fixes it.
FATAL: no more connections allowed (max_client_conn)
Managed pooler, 200 clients against our default of 100. Raise max_client_conn and the process’s open-file limit; PgBouncer logs both at startup (kernel file descriptor limit: 65536 ... max expected fd use: 2014).
FATAL: query_wait_timeout
Self-run pooler. A client waited longer than query_wait_timeout (default 120 s) for a server connection. With a one-connection pool, a 12-second query and a 5 s timeout, the second client gave up after 5.2 s as maxwait climbed.
FATAL: remaining connection slots are reserved for roles with the SUPERUSER attribute · FATAL: sorry, too many clients already
Direct to Postgres. The first means only superuser slots are left, the second that every slot is taken. With 1,000 churning clients, 189 got the first and 325 the second.
FATAL: server login has been failing, cached error: the database system is shutting down (server_login_retry)
During a Postgres restart. PgBouncer caches a failed server login for server_login_retry (default 15 s) and refuses new clients until it expires. Direct connections were back in 0.4 to 2.5 s. The self-run pooler, which didn’t attempt a login mid-shutdown, lost 0 to 1 queries. Lower server_login_retry to recover faster.
FATAL: SASL authentication failed · FATAL: no such user · server requested SASL authentication
Managed pooler (scram-sha-256 only): a wrong password, an unknown user, and a client that insists on md5 (libpq require_auth=md5), as old md5-only drivers do.
PgBouncer stats: reading SHOW POOLS and SHOW STATS
PgBouncer’s stats come from its admin console, a virtual database called pgbouncer on the pooler’s port. SHOW POOLS tells you whether the pool is too small, and SHOW STATS how long transactions wait for a server connection. Users listed in admin_users or stats_users can connect:
psql -h <pgbouncer-host> -p 6432 -U admin -d pgbouncer -c "SHOW POOLS"This is from our self-run pooler during the sweep, with a pool of 20 and 500 clients (columns trimmed):
 database | user  | cl_active | cl_waiting | sv_active | sv_idle | maxwait_us | pool_mode
----------+-------+-----------+------------+-----------+---------+------------+-------------
postgres | admin | 20 | 480 | 20 | 0 | 119592 | transaction- Pool too small:
cl_waitingabove zero andmaxwaitgrowing while database CPU has room. Here 480 clients each waited about 120 ms, almost all of their 123 ms median latency. - Pool too big: database CPU pinned, or latency rising as you add connections (our pool of 160).
SHOW STATS averages each counter over the last 60-second stats period. This is the self-run pooler after two minutes of steady load, 500 clients, 4 vCPU database:
 pool | avg_xact_count | avg_xact_time | avg_query_time | avg_wait_time
------+----------------+---------------+----------------+--------------
   20 |           4410 |        113205 |          16076 |        108671
   40 |           6598 |         75618 |          10703 |         69555
Times are in microseconds and include the wait for a server connection. Graph avg_xact_count (transactions per second), avg_wait_time, and avg_xact_time − avg_wait_time, the time a transaction really holds a connection: 4.5 ms at pool 20, 6.1 ms at 40. Doubling the pool cut the wait from 109 to 70 ms.
Little’s Law, which most sizing advice uses, fits these numbers. On the 4 vCPU database, 4,410 TPS × 4.5 ms per transaction means 20 connections busy at every instant, so Selfhost.dev’s pool of 20 was full. A pool of 40 served 6,598 TPS, 50% more.
The numbers to alert on
Three PgBouncer alerts, with thresholds from Selfhost.dev’s sweep:
cl_waiting> 0 for 5 minutes with database CPU under 70%. On 4 vCPU, pools of 5 to 20 ran at 41 to 67% CPU with about 480 clients waiting. That was 25 to 70% below peak throughput. Raise the pool.maxwaitabove 1 s for 5 minutes. Our most starved run kept p95 under 0.6 s.- PgBouncer above 70% of one core. It’s single-threaded and used 74 to 76% at 55,000 to 74,000 reads a second. Add processes with
so_reuseport.
PgBouncer Docker setup and configuration
A self-run PgBouncer needs a pinned image, a pgbouncer.ini, a user list and an open-file limit above max_client_conn. Ours ran in Docker on its own 2 vCPU server beside the database, on a private subnet whose firewall let only the benchmark client in.
edoburu/pgbouncer:v1.26.1-p0 is a community image of the official release. The PgBouncer project publishes source and links to distro packages, not a Docker image. Host networking keeps Docker’s NAT out of the path.
# docker-compose.yml
services:
  pgbouncer:
    image: edoburu/pgbouncer:v1.26.1-p0
    restart: unless-stopped
    network_mode: host
    ulimits:
      nofile: { soft: 65536, hard: 65536 }
    volumes:
      - ./pgbouncer.ini:/etc/pgbouncer/pgbouncer.ini:ro
      - ./userlist.txt:/etc/pgbouncer/userlist.txt:ro
# pgbouncer.ini
[databases]
* = host=<postgres-host> port=5432
[pgbouncer]
; set the host's private address to reach it from app servers;
; never 0.0.0.0 on a public IP: the admin console shares this port
listen_addr = 127.0.0.1
listen_port = 6432
auth_type = scram-sha-256
auth_file = /etc/pgbouncer/userlist.txt
admin_users = admin
stats_users = admin
pool_mode = transaction
max_client_conn = 2000
default_pool_size = 20
reserve_pool_size = 5
reserve_pool_timeout = 5
max_prepared_statements = 200
query_wait_timeout = 120
server_lifetime = 3600
server_idle_timeout = 600
ignore_startup_parameters = extra_float_digits,optionsuserlist.txt holds "user" "secret" lines, where the secret is a SCRAM verifier or a plain password. For many users, set auth_user and auth_query so PgBouncer reads SCRAM secrets from Postgres. Keep port 6432 closed to the internet and allow only your app servers through the firewall.
Keep the image current. PgBouncer 1.26.1 fixed three CVEs, including an authentication bypass: a client who knew one SCRAM user’s password could log in as another, admins included.
PgBouncer vs Pgpool-II vs PgCat vs RDS Proxy vs Supavisor
PgBouncer only pools connections. Pgpool-II adds read/write splitting and failover, PgCat adds replica load balancing, RDS Proxy is AWS’s managed pooler and Supavisor is Supabase’s. Selfhost.dev tested only PgBouncer; this table comes from each project’s docs.
| PgBouncer | Pgpool-II | PgCat | RDS Proxy | Supavisor | |
|---|---|---|---|---|---|
| Pool modes | session, transaction, statement | session only: a per-process connection cache (no transaction pooling, per the maintainer in 2016) | session, transaction | transaction-level reuse; pins the session when state changes | transaction and session (per Supabase’s docs) |
| Read/write split, load balancing | no split; round-robins new connections across a host list | yes, reads and writes told apart automatically | yes, reads balanced across replicas and primary | no split; Aurora clusters get read-only endpoints your app connects to | not yet (listed as future work) |
| Failover | no; it can’t skip an unreachable host | yes (high availability, watchdog) | routes around broken replicas after health checks | follows a Multi-AZ failover to the new primary | buffers connections briefly through restarts and failovers; doesn’t run Postgres failover |
| Threads | single-threaded (so_reuseport runs several processes) | multi-process | multi-threaded (Rust) | managed service | Elixir (BEAM) |
| Prepared statements, transaction mode | protocol-level, since 1.21 | n/a (session pooling) | README: not supported (an undocumented cache setting exists) | SQL PREPARE/EXECUTE pin the session | not supported (per Supabase’s docs) |
Session state (SET, temp tables, advisory locks, LISTEN) | breaks, as shown above | works (session pooling) | breaks in transaction mode | pins the session instead of breaking (per AWS docs) | dropped in transaction mode (per Supabase’s docs) |
| Where it runs | anywhere | anywhere | anywhere | AWS only, for RDS and Aurora | anywhere; built for Supabase |
| Latest release (as of 18 Nov 2026) | 1.26.1, 14 Oct 2026 | 4.7.3, Sep 2026 | last tag v1.2.0, Aug 2024; last commit Feb 2025 | managed service | 2.10.1, 14 Nov 2026 |
Sources: PgBouncer · Pgpool-II + maintainer, 2016 · PgCat · RDS Proxy concepts, pinning, endpoints · Supavisor + Supabase docs. Release dates from each GitHub repository.
RDS Proxy is billed separately: see RDS Proxy’s per-vCPU-hour pricing ($0.015 per vCPU-hour, 2-vCPU minimum) and what it adds to an RDS bill. Supavisor comes with the Supabase stack, including when self-hosting Supabase.
When to pick another pooler
“If all I need is more connections, I use PgBouncer. It is small, it still ships releases, and this post shows how it fails. I haven’t run Pgpool-II, PgCat or RDS Proxy myself, so this part comes from their docs. To send reads to replicas without changing app code, I’d try Pgpool-II before PgCat. PgCat’s last release was in 2024, and its README says prepared statements don’t work in transaction mode. On RDS or Aurora, RDS Proxy is one less thing to run. It pins the session on any
SET, so an app that sets values per connection gets little pooling from it.”
Mohammad Aziz, backend engineer, Selfhost.dev
PgBouncer production checklist
A production PgBouncer comes down to eight settings and habits, each taken from a test above. The first three size the pool and pick the mode. The next three stop session state from breaking, and the last two keep the pooler visible and patched.
- Size
default_pool_sizefrom database CPU, then measure: 40 won at 500 clients on 2 vCPU. - Keep pools × (pool size + reserve) plus direct connections under
max_connectionsminus reserved slots. - Default to transaction mode; give session mode only to clients that need it.
- Keep
max_prepared_statementsabove 0 for ORM prepared statements. - Use
SET LOCALor per-role settings, andpg_advisory_xact_lock. - Run migrations, dumps and
LISTENon a direct connection. - Set
query_wait_timeoutbelow your app’s timeout; alert oncl_waitingandmaxwait. - Raise the open-file limit above
max_client_conn, use scram-sha-256, and run 1.26.1 or later.
Should you run PgBouncer yourself or use managed pooling?
PgBouncer pays off with more than a couple of hundred clients, a connection per request, or connection errors as you scale. There it turned Selfhost.dev’s failed runs into working ones and cut database CPU from 61% to 17%. Whether to run it yourself depends on what you need to see and control.
- Wait if one or two app servers with well-sized pools stay under
max_connections, or your app relies on session state. Fix that code first. - Run your own PgBouncer if you tune from
SHOW POOLScounters or need read/write splitting beside it. - Choose Selfhost.dev managed pooling if you want a patched PgBouncer without running one. It is a toggle on managed Postgres from $8.10/mo in Mumbai.
Turn on pooling for a new managed Postgres instance with the $5 welcome credit, no card needed, and set the pool near 40 on an 8 GB instance.
PgBouncer FAQ
What port does PgBouncer use?
PgBouncer uses port 6432 by convention, and both Selfhost.dev’s managed pooling and our self-run PgBouncer used it. Postgres stays on 5432, so apps switch to pooling by changing only the port. Keep 5432 reachable for migrations, dumps and LISTEN, which should not go through a transaction-mode pool.
How many connections can PgBouncer handle?
One self-run PgBouncer 1.26.1 held 1,000 clients at 4,578 TPS using 28% of one CPU core in Selfhost.dev’s test. It is single-threaded, so query rate matters more than client count: at 74,000 read queries a second it used 74% of a core. Past that, run several processes with so_reuseport.
What is the difference between PgBouncer and Pgpool-II?
PgBouncer is a lightweight connection pooler with transaction pooling. Pgpool-II pools connections per session and adds load balancing, read/write splitting and failover. If you only need more connections, PgBouncer is simpler; if you need replicas used automatically, Pgpool-II does more but has more to configure and run.
Do prepared statements work with PgBouncer transaction mode?
Yes, protocol-level prepared statements work in PgBouncer transaction mode since 1.21, when max_prepared_statements is above 0 (the default is 200 since 1.24.0). In Selfhost.dev’s test, 20 psycopg clients ran 1,000 prepared queries with no errors; with the setting at 0, 18 of 20 failed. SQL-level PREPARE still fails.
Does PgBouncer work with Postgres 19?
PostgreSQL 19 was released on 19 November 2026, and PgBouncer’s release notes up to 1.26.1 don’t mention it yet, so check them before you upgrade. Selfhost.dev tested on PostgreSQL 18.7. Postgres 19 warns on md5 logins, so use scram-sha-256 from client to pooler to database.
Keep reading: Managed PostgreSQL on Selfhost.dev · Compare managed Postgres providers on price and features · What every AWS RDS charge costs, RDS Proxy included · n8n queue mode, tested with 1, 2 and 4 workers
Based on this page: ·
On now or still deciding?
What's the bill you're looking at?
Roughly how much a month, all in?
Matched to RDS, we bill 3.0x less in ap-south-1 (Mumbai) and 2.1x less in us-east-1.
2 vCPU / 4 GB with 20 GB: $24.54/mo in Mumbai, $35.27/mo in us-east-1, against an estimated $73.75/mo on RDS.
See a real RDS bill, before and after →Neon meters compute hours and sleeps. We bill one fixed hourly rate and never sleep.
{price} Same number in a quiet month and a launch month.
Price your size →Two ways off the Supabase bill and you can keep the Supabase stack.
Self-host Supabase on a managed server: a European 8 GB server is $0.03/hr or move just the database to a dedicated Postgres. {price}
How self-hosted Supabase works here →An enterprise client is moving production ClickHouse to us at up to 60% less.
Worked example: off ClickHouse Cloud Scale to always-on managed ClickHouse, $891.86 to $364.03 a month, 59%.
See the ClickHouse bill, before and after →A PaaS bills per service. A project server is one bill for everything on it.
Worked example: a studio consolidated client hosting onto project servers, $390.00 to $82.66 a month, 78%.
See that bill, before and after →Managed PostgreSQL from $8.10 a month in Mumbai. Dedicated Postgres or MySQL on AWS, with restore, pooling and Multi-AZ failover when you want it.
{price} Postgres and MySQL price the same.
Price your size →Managed PostgreSQL from $8.10 a month in Mumbai. Dedicated Postgres or MySQL on AWS, with restore, pooling and Multi-AZ failover when you want it.
{price}
Price your size →Managed PostgreSQL from $8.10 a month in Mumbai. Dedicated Postgres or MySQL on AWS, with restore, pooling and Multi-AZ failover when you want it.
{price} Pay-as-you-go credits, top up from $5, no plan tiers.
Price your size →Most setups map onto two shapes: dedicated databases on AWS and a project server for everything else.
{price} Project servers from about $0.02/hr in Europe.
Price your size →Under $200 a month, the calculator beats a human reply. Price it there first.
What's it for?
Where do your users mostly sit?
Dedicated managed Postgres or MySQL, with point-in-time restore, pooling and Multi-AZ failover when you want it.
{region} If you need scale-to-zero or instant branching, Neon fits better than we do.
What managed Postgres includes →Managed ClickHouse for events at volume or TimescaleDB on managed Postgres for time-series next to your app data.
Worked example: off ClickHouse Cloud Scale, $891.86 to $364.03 a month, 59%. {region}
See the ClickHouse bill, before and after →pgvector on managed Postgres: one database instead of a second vendor.
{region} TimescaleDB is one click away on the same instance if you also have time-series.
When a dedicated vector DB is worth it →A project server from about $0.02/hr in Europe: push to GitHub and it deploys, several apps and their databases on one box.
Auto-deploy on push, PR previews, custom domains. The $5 welcome credit covers the start of it, no card needed; it bills by the hour.
How Projects work →Project servers: many sites per server, one bill.
Worked example: a studio consolidated client hosting, $390.00 to $82.66 a month, 78%.
See that bill, before and after →Most things fit dedicated databases on AWS plus a project server for the apps.
{region}
See it in the live demo →What are you trying to do?
Which editor?
We migrate you, free, on every plan size.
An engineer runs it with you: match the instance, replicate or dump and restore, test the restore, cut over.
See one migration, step by step →The Supabase stack, one click, on a server of your own.
One click from the template. A European 8 GB server is $0.03/hr. Nothing to build or wire up.
Self-hosted Supabase in one click →Paste one config and your editor can run the whole backend.
Run it once, sign in when the browser opens and all 269 tools register.
An hourly instance you stop when you are done.
Restore a snapshot into a second instance, point staging at it and stop it when idle: only its storage bills while it is stopped.
Price a small instance →Push to GitHub and it's live: auto-deploy, PR previews, custom domains.
A project server from about $0.02/hr in Europe runs several apps and their databases.
Deploy guides by framework →The one that matters most:
Managed PostgreSQL from $8.10 a month in Mumbai. Project servers from about $0.02 an hour in Europe.
The smallest dedicated Postgres, a 1 GB t4g.micro with 1 GB of storage, is $8.10 a month in ap-south-1 (Mumbai) and $10.55 in us-east-1; the $5 welcome credit goes toward it. Pay-as-you-go credits, top up from $5, no tiers.
Price your size →When production needs help, you talk to the engineers who run it and a founder reads every request.
Outages, restores, performance issues and migrations reach the people operating the platform. No response-time promise or uptime percentage we cannot prove.
How support and recovery work →Failover, point-in-time restore and backups cover the common ways a database fails.
Multi-AZ failover is a toggle on Postgres, MySQL, Redis and ClickHouse and a cluster you pick at create on OpenSearch; Postgres and MySQL add point-in-time restore and every engine gets automated backups, live metrics and alerts.
The reliability and recovery details →We migrate you, free. An engineer plans and runs the move with you.
Match the instance, replicate or dump and restore, test the restore, cut over. Any plan size, no extra cost.
See one migration, step by step →Run it in your own AWS account with BYOC, in the region you need.
Encryption at rest on every managed instance; client TLS is a switch on PostgreSQL, MySQL and ClickHouse and always on for OpenSearch. We do not hold SOC 2 or HIPAA today and we will say so before you spend an hour.
What we can and cannot certify →Fair enough. The live demo is the fastest way to see it.
Or claim $5 to start, no card needed.
Watch the live demo →Our founder
You've already sent us your setup from this browser. A founder will reply to it; no need to send it twice.
Got it. I'll reply to within two working days, from my own inbox.
Noted. One note when it changes, nothing else.
Run managed Postgres, your way.
Dedicated PostgreSQL on AWS with PITR, connection pooling, Multi-AZ, pgvector and BYOC. From $8.10/mo in Mumbai (ap-south-1), with no surprise invoices. Limited-time offer: get $5 in free credit at signup, no card needed.
Based on this page: ·
On now or still deciding?
What's the bill you're looking at?
Roughly how much a month, all in?
Matched to RDS, we bill 3.0x less in ap-south-1 (Mumbai) and 2.1x less in us-east-1.
2 vCPU / 4 GB with 20 GB: $24.54/mo in Mumbai, $35.27/mo in us-east-1, against an estimated $73.75/mo on RDS.
See a real RDS bill, before and after →Neon meters compute hours and sleeps. We bill one fixed hourly rate and never sleep.
{price} Same number in a quiet month and a launch month.
Price your size →Two ways off the Supabase bill and you can keep the Supabase stack.
Self-host Supabase on a managed server: a European 8 GB server is $0.03/hr or move just the database to a dedicated Postgres. {price}
How self-hosted Supabase works here →An enterprise client is moving production ClickHouse to us at up to 60% less.
Worked example: off ClickHouse Cloud Scale to always-on managed ClickHouse, $891.86 to $364.03 a month, 59%.
See the ClickHouse bill, before and after →A PaaS bills per service. A project server is one bill for everything on it.
Worked example: a studio consolidated client hosting onto project servers, $390.00 to $82.66 a month, 78%.
See that bill, before and after →Managed PostgreSQL from $8.10 a month in Mumbai. Dedicated Postgres or MySQL on AWS, with restore, pooling and Multi-AZ failover when you want it.
{price} Postgres and MySQL price the same.
Price your size →Managed PostgreSQL from $8.10 a month in Mumbai. Dedicated Postgres or MySQL on AWS, with restore, pooling and Multi-AZ failover when you want it.
{price}
Price your size →Managed PostgreSQL from $8.10 a month in Mumbai. Dedicated Postgres or MySQL on AWS, with restore, pooling and Multi-AZ failover when you want it.
{price} Pay-as-you-go credits, top up from $5, no plan tiers.
Price your size →Most setups map onto two shapes: dedicated databases on AWS and a project server for everything else.
{price} Project servers from about $0.02/hr in Europe.
Price your size →Under $200 a month, the calculator beats a human reply. Price it there first.
What's it for?
Where do your users mostly sit?
Dedicated managed Postgres or MySQL, with point-in-time restore, pooling and Multi-AZ failover when you want it.
{region} If you need scale-to-zero or instant branching, Neon fits better than we do.
What managed Postgres includes →Managed ClickHouse for events at volume or TimescaleDB on managed Postgres for time-series next to your app data.
Worked example: off ClickHouse Cloud Scale, $891.86 to $364.03 a month, 59%. {region}
See the ClickHouse bill, before and after →pgvector on managed Postgres: one database instead of a second vendor.
{region} TimescaleDB is one click away on the same instance if you also have time-series.
When a dedicated vector DB is worth it →A project server from about $0.02/hr in Europe: push to GitHub and it deploys, several apps and their databases on one box.
Auto-deploy on push, PR previews, custom domains. The $5 welcome credit covers the start of it, no card needed; it bills by the hour.
How Projects work →Project servers: many sites per server, one bill.
Worked example: a studio consolidated client hosting, $390.00 to $82.66 a month, 78%.
See that bill, before and after →Most things fit dedicated databases on AWS plus a project server for the apps.
{region}
See it in the live demo →What are you trying to do?
Which editor?
We migrate you, free, on every plan size.
An engineer runs it with you: match the instance, replicate or dump and restore, test the restore, cut over.
See one migration, step by step →The Supabase stack, one click, on a server of your own.
One click from the template. A European 8 GB server is $0.03/hr. Nothing to build or wire up.
Self-hosted Supabase in one click →Paste one config and your editor can run the whole backend.
Run it once, sign in when the browser opens and all 269 tools register.
An hourly instance you stop when you are done.
Restore a snapshot into a second instance, point staging at it and stop it when idle: only its storage bills while it is stopped.
Price a small instance →Push to GitHub and it's live: auto-deploy, PR previews, custom domains.
A project server from about $0.02/hr in Europe runs several apps and their databases.
Deploy guides by framework →The one that matters most:
Managed PostgreSQL from $8.10 a month in Mumbai. Project servers from about $0.02 an hour in Europe.
The smallest dedicated Postgres, a 1 GB t4g.micro with 1 GB of storage, is $8.10 a month in ap-south-1 (Mumbai) and $10.55 in us-east-1; the $5 welcome credit goes toward it. Pay-as-you-go credits, top up from $5, no tiers.
Price your size →When production needs help, you talk to the engineers who run it and a founder reads every request.
Outages, restores, performance issues and migrations reach the people operating the platform. No response-time promise or uptime percentage we cannot prove.
How support and recovery work →Failover, point-in-time restore and backups cover the common ways a database fails.
Multi-AZ failover is a toggle on Postgres, MySQL, Redis and ClickHouse and a cluster you pick at create on OpenSearch; Postgres and MySQL add point-in-time restore and every engine gets automated backups, live metrics and alerts.
The reliability and recovery details →We migrate you, free. An engineer plans and runs the move with you.
Match the instance, replicate or dump and restore, test the restore, cut over. Any plan size, no extra cost.
See one migration, step by step →Run it in your own AWS account with BYOC, in the region you need.
Encryption at rest on every managed instance; client TLS is a switch on PostgreSQL, MySQL and ClickHouse and always on for OpenSearch. We do not hold SOC 2 or HIPAA today and we will say so before you spend an hour.
What we can and cannot certify →Fair enough. The live demo is the fastest way to see it.
Or claim $5 to start, no card needed.
Watch the live demo →Our founder
You've already sent us your setup from this browser. A founder will reply to it; no need to send it twice.
Got it. I'll reply to within two working days, from my own inbox.
Noted. One note when it changes, nothing else.